GitHub Contributor Metrics - All Repos
Community Reports Series
GitHub report for the all repos from the Ansible ecosystem
This report covers the contributors to the Fedora-Infra community on GitHub.
Dataset
The section “All” was requested. The data comprises all Issues, PRs (including the comments) from 90 GitHub repositories over 1 GitHub Organisations. Please contact us if you’d like to see this report for a different subset of the repos.
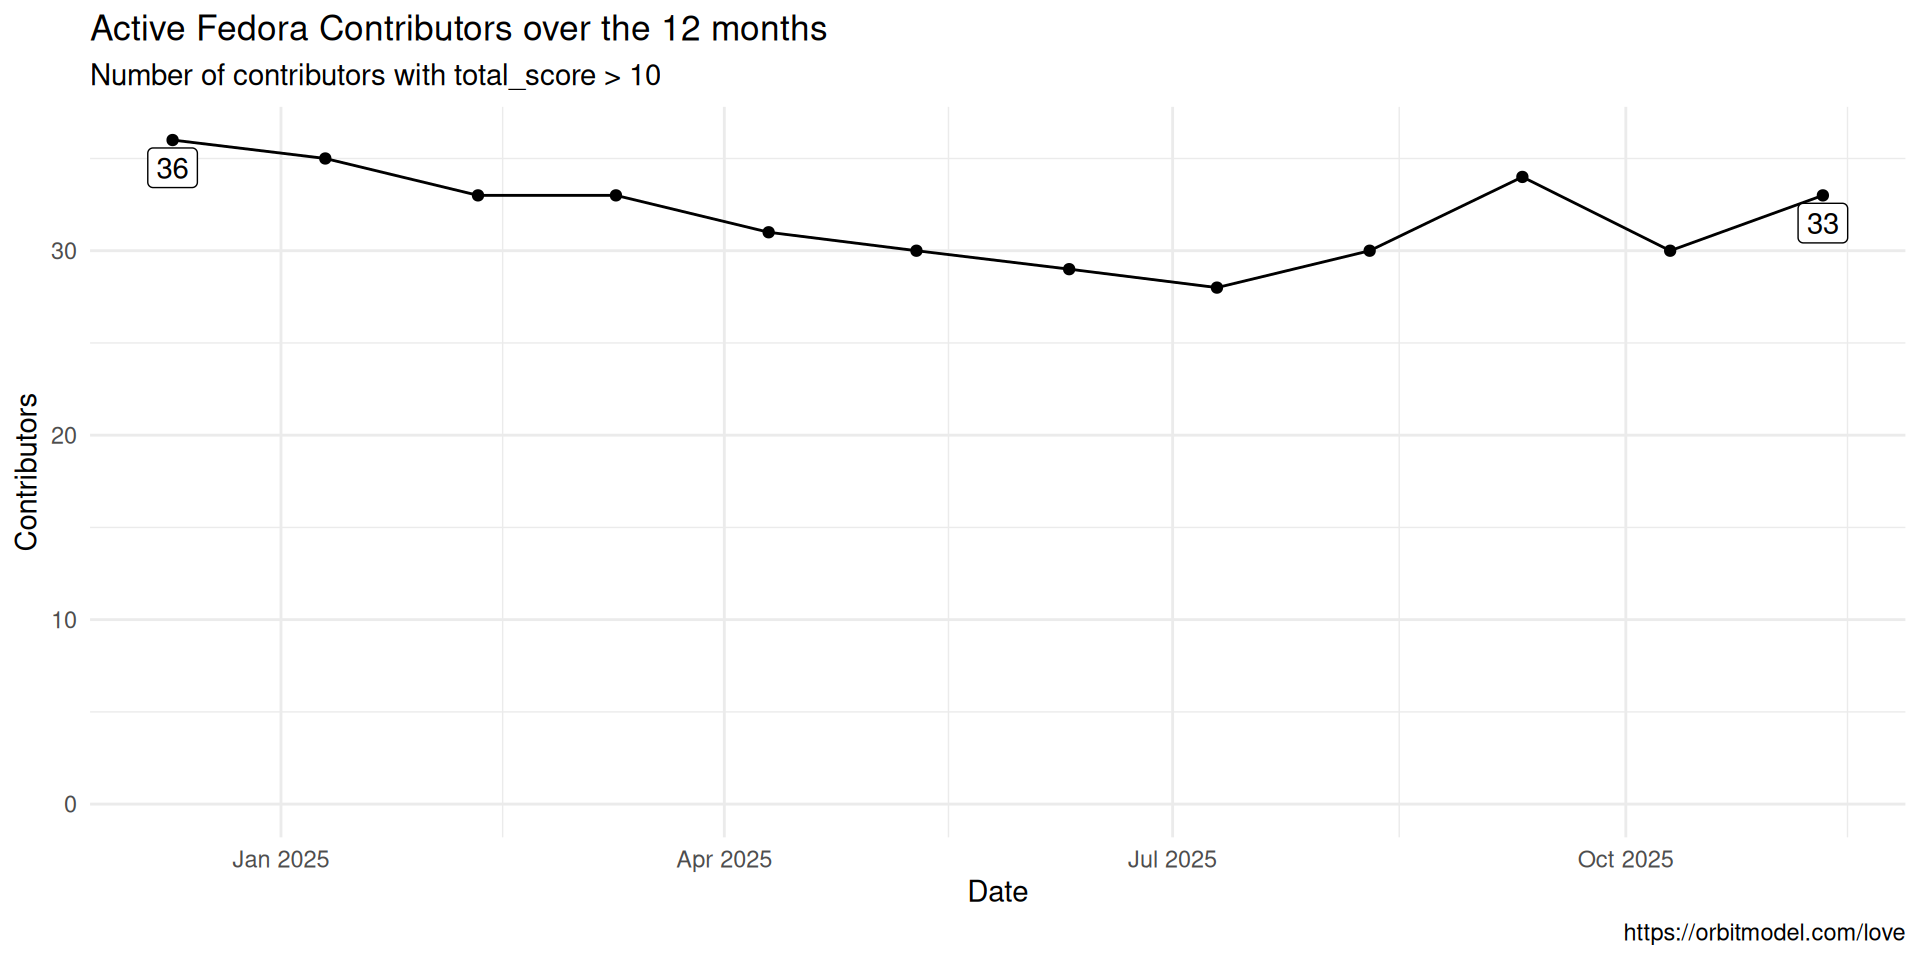
Active contributors
This plot uses the Orbit-Love model to count activity, and includes any person who has a minimum threshold of activity. See the Processing Notes appendix for details on the calculations.
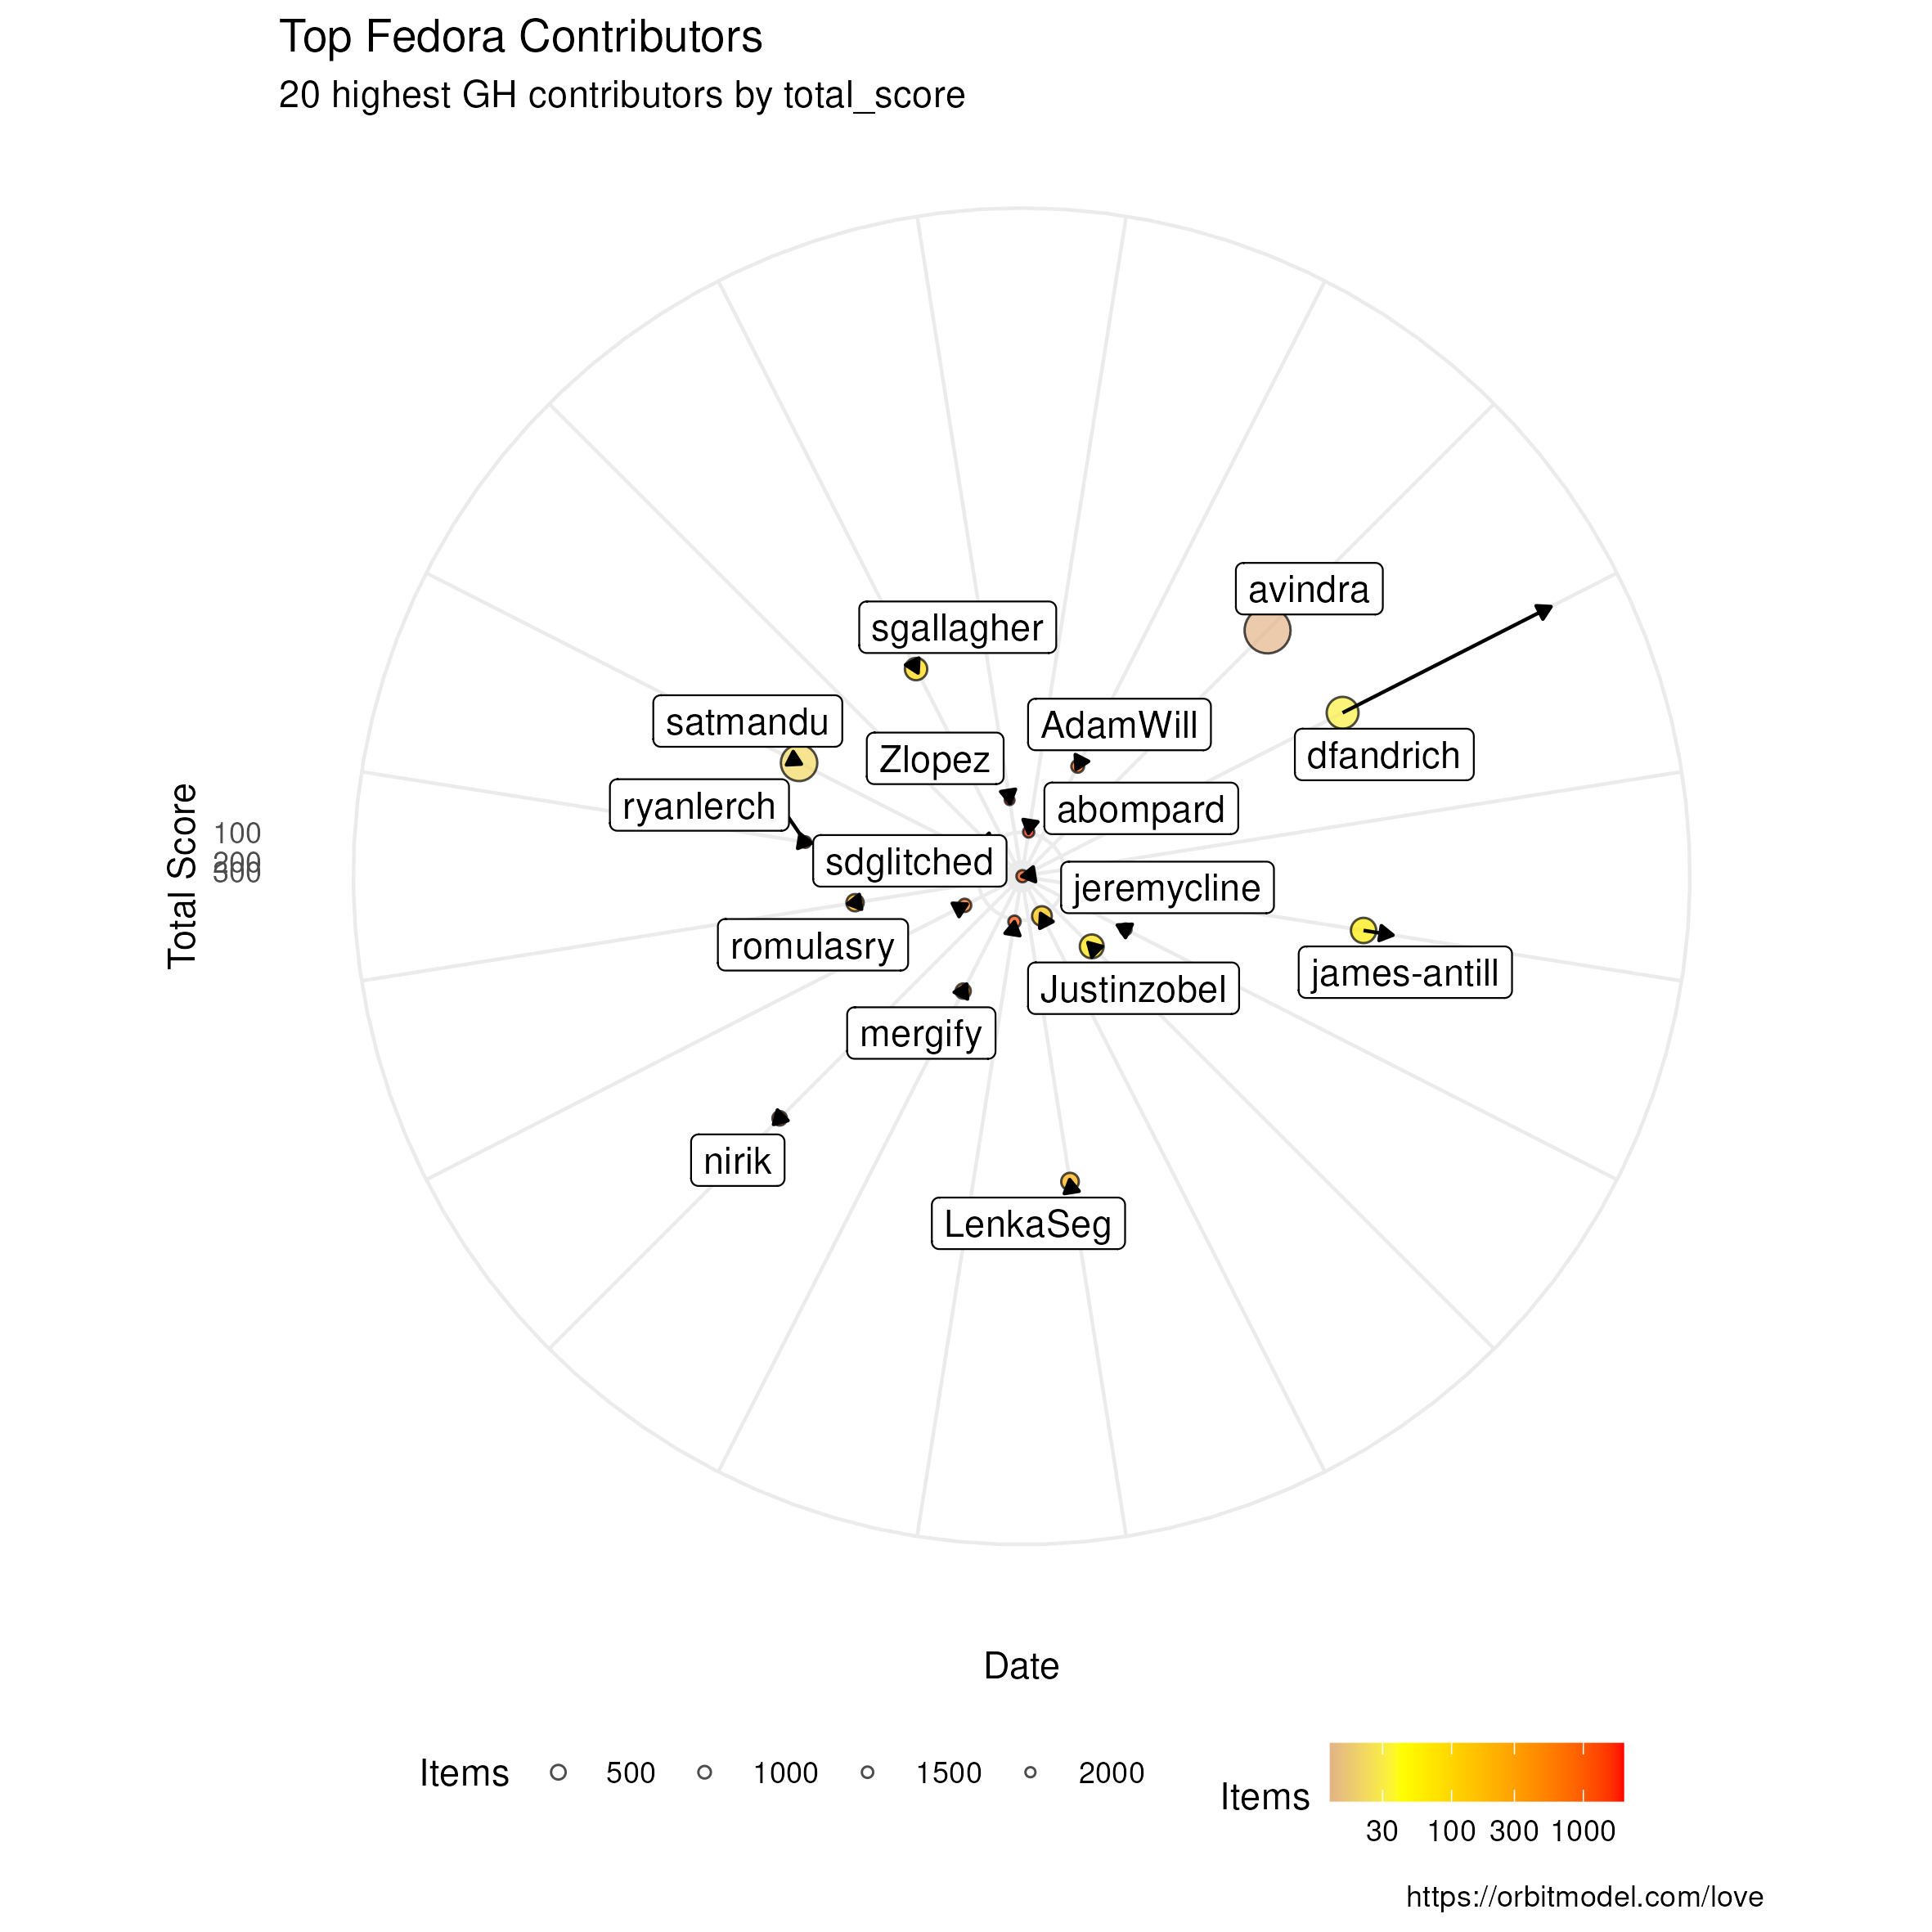
Top Contributors Orbit plot
| author | total_score | slope |
|---|---|---|
| jeremycline | 44.7 | 0.8 |
| mergify | 41.0 | 0.6 |
| gridhead | 372.0 | 0.5 |
| konflux-fedora | 98.7 | 0.5 |
| sdglitched | 100.8 | 0.5 |
| Justinzobel | 51.6 | 0.5 |
| nphilipp | 74.6 | 0.4 |
| Zlopez | 64.0 | 0.3 |
| ryanlerch | 25.2 | 0.3 |
| AdamWill | 42.6 | 0.3 |
| abompard | 98.4 | 0.2 |
| sgallagher | 23.8 | 0.2 |
| LenkaSeg | 18.2 | 0.1 |
| satmandu | 22.2 | 0.1 |
| mattiaverga | 96.6 | 0.0 |
| nirik | 16.5 | -0.2 |
| romulasry | 32.1 | -0.4 |
| james-antill | 16.3 | -0.8 |
| dfandrich | 15.7 | -3.8 |
| avindra | 16.2 | NA |
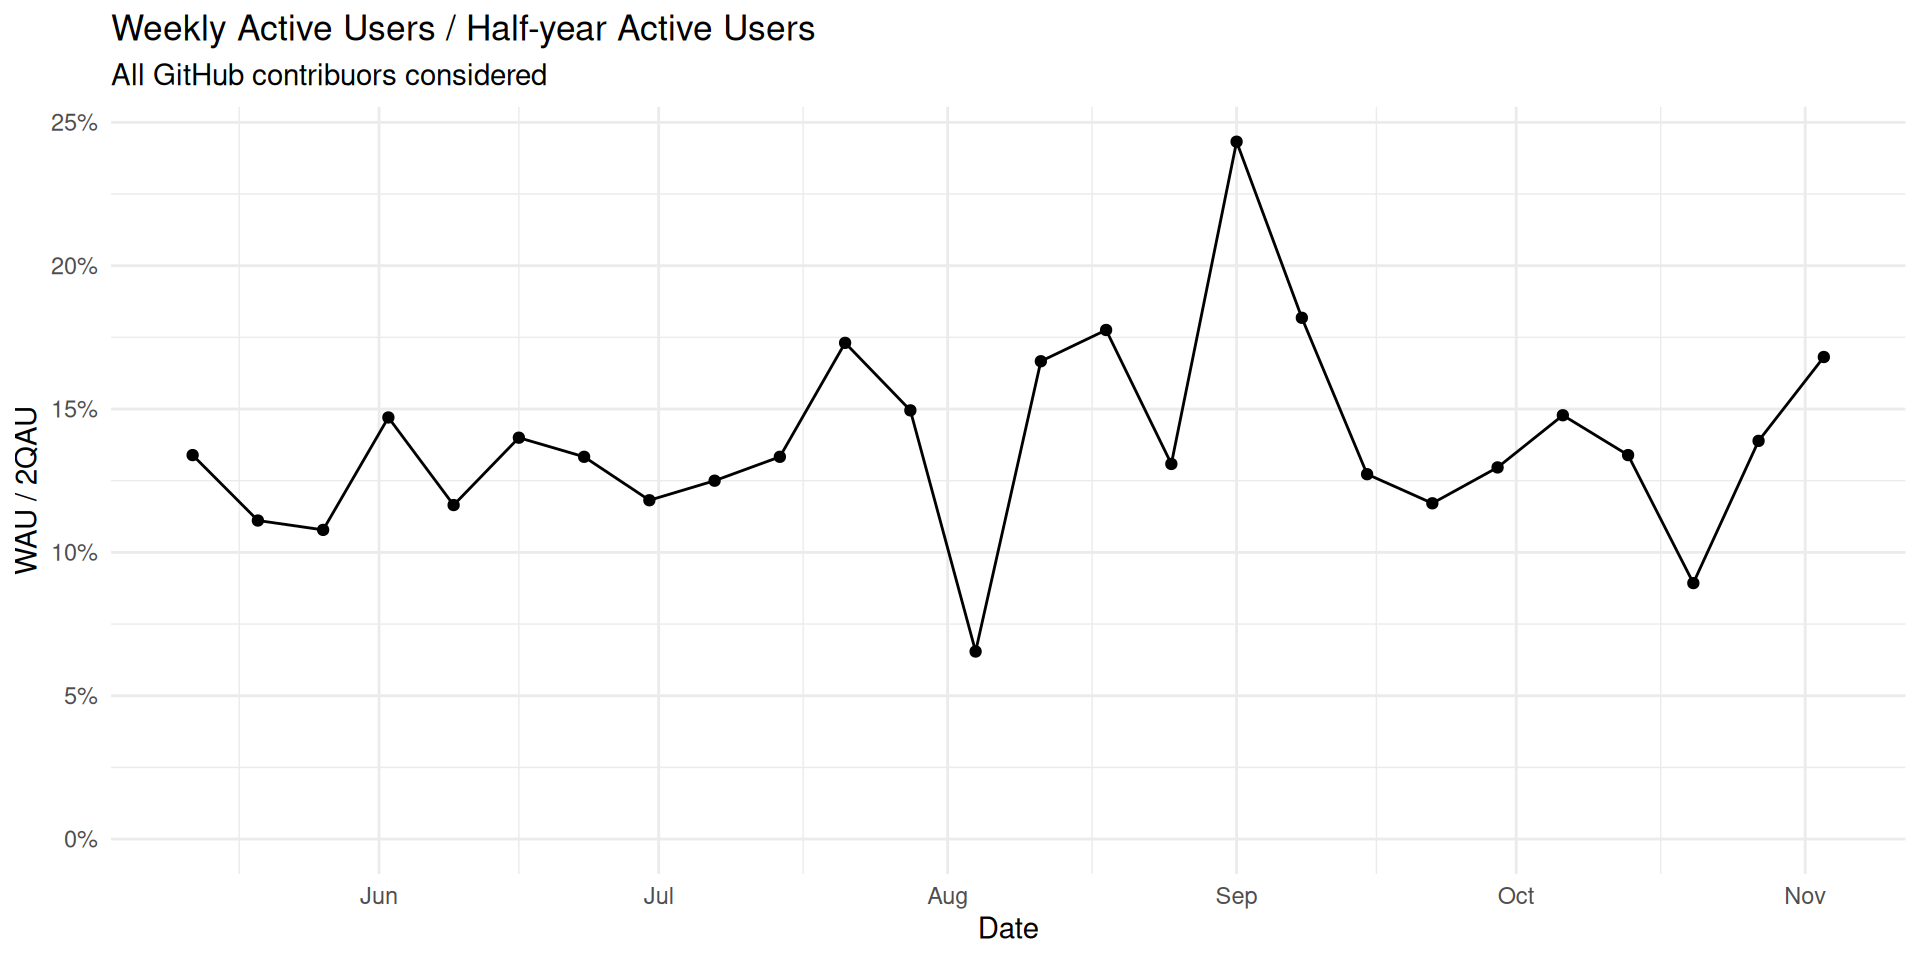
Contributor Retention
This plot uses the concept of “Weekly Active Users” and “Half-Year Active Users” to express a ratio (WAU / 2QAU). The higher this ratio, the better we are doing at retaining people:
- TODO - can cohort analysis help?
- TODO - some survival analysis of churn here?
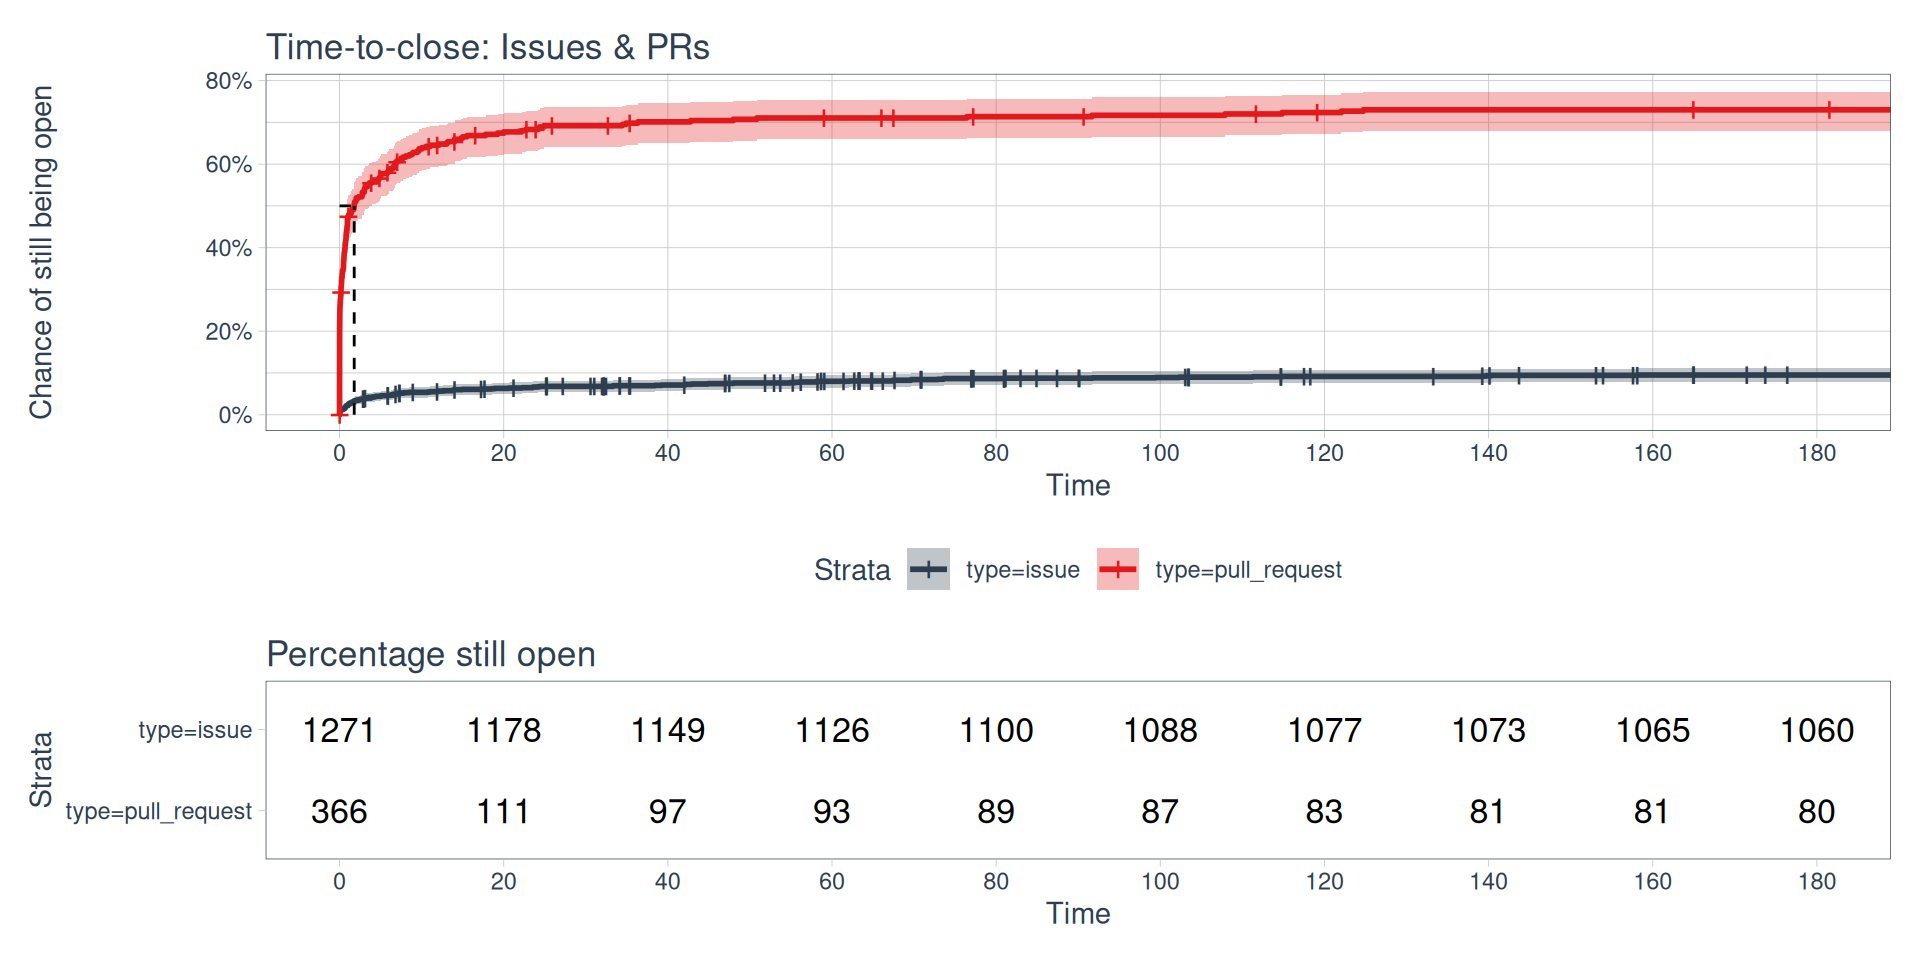
Responsiveness of users
We’d lie to know two things - how quickly we respond to Issues & PRs, and how quickly we get them closed
Processing Notes
The Orbit-Love Scores are: - Issues = 1 - PRs = 1.4 - Issue Comments = 1.4 - PR Comments = 1.6 - Self-comments = 0.2 (multiplier) - Monthly Decay = 0.9 - Hard-cap timeout = 365 days
The Survival curves count any Issue/PR closed in the last 6 months, or still open at the time of calculation
Contact
This report was prepared by Greg Sutcliffe, please contact me if you have questions.